Average Wimbledon House Price Reaches Record High During Lockdown
Demand for family homes remained robust despite pandemic
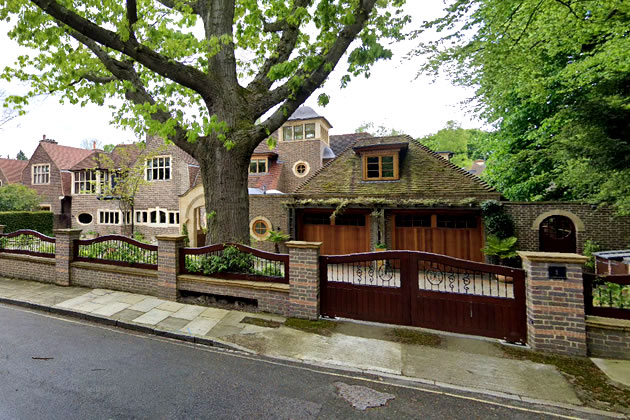
Lampton House formerly the home of Ridley Scott went for £6,700,000
The average price of a home sold in Wimbledon during the first lockdown has confounded expectations by reaching an all-time high.
According to figures from the Land Registry, there were 104 sales recorded in the SW19 postcode area in the second quarter of this year and for the first time they averaged over £1,000,000.
Compared with the same period in 2019 the level rose by 29.1% to £1,061,109. Market analysts believe that the extent of the rise has been driven by mainly technical factors with the demand for large family homes in Wimbledon remaining robust despite the uncertainty where the volume of sales of former properties has fallen sharply.
In the third quarter the average appears to have fallen back again towards the £800,000 level although not all transactions that took place in this period are reflected in the numbers at this point.
One local estate agent said, “The market is being shaped by the attitude of lenders at the moment. They are extremely risk averse and will only provide mortgages at very high equity to loan ratios. People who are looking to buy houses tend to be sitting on large capital gains on their existing properties or have other sources of capital to make them an attractive risk. Younger people looking to buy their first or second home are really struggling to find a bank or a building society that will support them because all the lenders are assuming a 15-20% fall in the market.
“Whether the average is a true reflection of the market is hard to say. Looking at properties on a like for like basis we don’t seem to be that far off record levels so it isn’t completely misleading.”
It is also believed that the stamp duty holiday announced by the government after the pandemic broke is helping prop up demand for bigger residential properties as the savings offered are greater for larger homes.
Since the start of the first lockdown there have been five properties sold for over £4,000,000 in the Wimbledon area including an 8 bedroom detached house on Somerset Road near the All England Tennis Club which went for £8,500,000 in May. Lampton House on Lampton House Close changed hands for £6,700,000 in July having been bought for £875,000 back in 1995. The ‘Arts and Crafts’ house built in the 19th century formerly belonged to film director Ridley Scott and has been extensively renovated.

Nationally the Nationwide House Price Index showed a year on year increase of 5% to £226,129 up to the end of September. For London the average has risen by 4.4% over the year to £480,857.
Robert Gardner, Nationwide's Chief Economist, said: “Housing market activity has recovered strongly in recent months. Mortgage approvals for house purchase rose from c66,000 in July to almost 85,000 in August - the highest since 2007, well above the monthly average of 66,000 prevailing in 2019.
“The rebound reflects a number of factors. Pent-up demand is coming through, with decisions taken to move before lockdown now progressing. The stamp duty holiday is adding to momentum by bringing purchases forward. Behavioural shifts may also be boosting activity as people reassess their housing needs and preferences as a result of life in lockdown.”
WimbledonSW19.com is the only place that you will find detailed analysis of the Wimbledon property market. Register to receive fortnightly updates including regular reports like this one.
Wimbledon Property Prices (July - September 2020) |
||||||||||
|---|---|---|---|---|---|---|---|---|---|---|
| Area | Detached | Sales | Semi-det | Sales | Terrace | Sales | Flat/ mais |
Sales | Overall ave | Total sales |
| SW19 1 | 0 | 0 | 0 | 0 | 701750 | 6 | 500708 | 10 | 576099 | 16 |
| SW19 2 | 715000 | 1 | 585000 | 2 | 381500 | 2 | 355071 | 7 | 427792 | 12 |
| SW19 3 | 1067000 | 1 | 1160000 | 3 | 859233 | 3 | 381417 | 6 | 724092 | 13 |
| SW19 4 | 4995000 | 1 | 887500 | 2 | 970000 | 1 | 599486 | 7 | 1085127 | 11 |
| SW19 5 | 2550000 | 1 | 0 | 0 | 1225000 | 2 | 742000 | 1 | 1435500 | 4 |
| SW19 6 | 2085000 | 1 | 0 | 0 | 685000 | 1 | 356067 | 3 | 767640 | 5 |
| SW19 7 | 3950000 | 1 | 0 | 0 | 1200000 | 2 | 581250 | 4 | 1239286 | 7 |
| SW19 8 | 0 | 0 | 1404000 | 2 | 970091 | 11 | 250437 | 4 | 851809 | 17 |
| Total | 2560333 | 6 | 1025889 | 9 | 883114 | 28 | 455105 | 42 | 805137 | 85 |
Change in Quarter |
-22.4% | -50.0% | -33.2% | -50.0% | 16.3% | -9.7% | -0.1% | -2.3% | -24.1% | -18.3% |
Change in year |
-10.9% | -53.8% | -23.2% | -70.0% | 4.9% | -70.2% | -2.3% | -69.3% | 0.1% | -69.0% |
Change in Three Years |
-3.7% | -57.1% | -19.9% | -73.5% | 5.0% | -70.8% | -3.7% | -73.2% | 2.8% | -71.8% |
Change in Five Years |
0.2% | -68.4% | -29.9% | -76.9% | 7.3% | -78.0% | 7.7% | -74.2% | 0.4% | -75.6% |
Change in Ten Years |
-14.9% | -62.5% | 22.1% | -83.0% | 60.4% | -77.2% | 58.9% | -78.1% | 43.6% | -77.9% |
Wimbledon Property Prices (April - June 2020) |
||||||||||
|---|---|---|---|---|---|---|---|---|---|---|
| Area | Detached | Sales | Semi-det | Sales | Terrace | Sales | Flat/ mais |
Sales | Overall ave | Total sales |
| SW19 1 | 0 | 0 | 750000 | 2 | 751455 | 11 | 383300 | 10 | 591261 | 23 |
| SW19 2 | 0 | 0 | 0 | 0 | 481000 | 5 | 445000 | 1 | 475000 | 6 |
| SW19 3 | 2695000 | 1 | 1096000 | 5 | 700750 | 2 | 322737 | 4 | 905621 | 12 |
| SW19 4 | 2403333 | 3 | 2750000 | 1 | 0 | 0 | 470591 | 6 | 1278355 | 10 |
| SW19 5 | 7250000 | 2 | 0 | 0 | 0 | 0 | 754500 | 5 | 2610357 | 7 |
| SW19 6 | 2760000 | 1 | 950000 | 2 | 898258 | 4 | 402136 | 11 | 704252 | 18 |
| SW19 7 | 2489000 | 5 | 2121116 | 7 | 0 | 0 | 502500 | 2 | 2021272 | 14 |
| SW19 8 | 0 | 0 | 1150000 | 1 | 874611 | 9 | 496750 | 4 | 786321 | 14 |
| Total | 3300833 | 12 | 1534879 | 18 | 759259 | 31 | 455360 | 43 | 1061109 | 104 |
Change in Quarter |
19.0% | 33.3% | 18.3% | -37.9% | -3.0% | -51.6% | 4.2% | -53.3% | 34.7% | -46.4% |
Change in year |
31.8% | -7.7% | 34.1% | -40.0% | -7.6% | -54.4% | -3.4% | -52.2% | 29.1% | -48.3% |
Change in Three Years |
9.9% | -14.3% | 40.7% | -30.8% | -4.2% | -58.7% | 3.0% | -61.9% | 34.6% | -54.4% |
Change in Five Years |
30.1% | -33.3% | 26.3% | -50.0% | 6.7% | -68.4% | 13.8% | -74.7% | 50.4% | -67.7% |
Change in Ten Years |
14.3% | 0.0% | 57.1% | -47.1% | 52.9% | -73.3% | 55.7% | -75.8% | 103.2% | -69.4% |
Source: Land Registry
February 14, 2020