Big Ticket House Sales Bright Spot for Wimbledon Property
Prices continue to edge higher as turnover plunges to historical lows

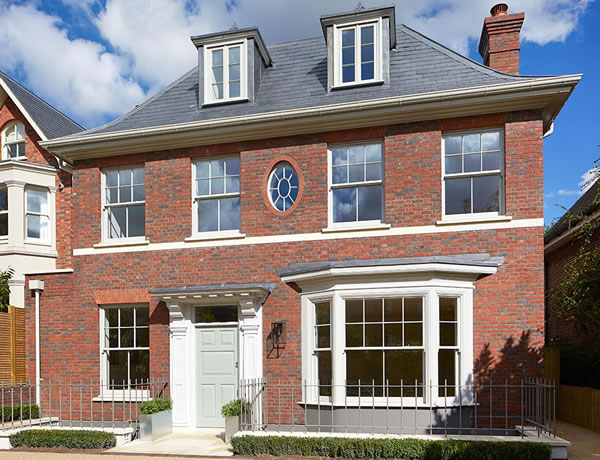
New build six bedroom house in St. Mary's Road went for £5.2 million
Wimbledon house prices seem to be performing better than the rest of London aided by continuing demand for large homes in the area. However, SW19 has not been immune to the collapse in the number of properties changing hands seen in the capital over the last year.
Seven Wimbledon residential properties each sold for £3 million or more in the past quarter as the latest figures from the Land Registry show the average price of an SW19 home sold during the same time frame was just over £850,000, up by 8% over the year as prices across London fell.
The sales data shows the average price of properties sold in the SW19 postcode area from April – June 2018 was £851,752. This is a new record high for the area, the record level achieved in the previous quarter was revised down after late reported sales brought down the average.
The sustainability of rising prices may be fragile as they are occurring at a time when the level of turnover is reaching historically low levels. The number of properties sold in the quarter is likely to be below that seen during the financial crisis in 2008 even allowing for more sales to be reported.
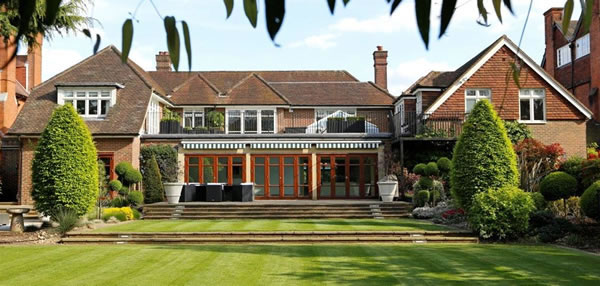
Prices across the latest quarter rose by an average of 4.9%, boosted by seven sales of £3 million or more. These range from the £3 million sale of the former Manor Club in Kingston Road, South Wimbledon, in April to the £5.8 million sale of a house in Alan Road, Wimbledon Village, in the same month. The Alan Road property featured 5 bedrooms, 6 bathrooms and an indoor pool.

Alan Road property was highest priced sale at £5.8million
More recently, a four-storey new-build house, with six bedrooms, in St Mary’s Road, Wimbledon Village, was sold for £5.2 million in June.
Away from the top end of the market, the number of flat sales has fallen again – a decrease of 35.9% in just three months. But the average price of the 66 flats sold in SW19 in the latest quarter did rise by 3.5% to £468,216.
There were 54 terraced homes sold in SW19 from April to June, with their average year-on-year price increasing by 2.1% to £808,531.
The latest House Price Index data published by the Land Registry shows that London prices are the only ones that have fallen over the last year (to May) with the average now £478,853.
Figures for July from the Nationwide House Price Index show that the average price of a home in the UK rose by 2.5% to £217,010.
The was before the Bank of England’s Monetary Policy Committee (MPC) will increased rates at their next meeting at the beginning of the month from 0.5% to 0.75%.
There is not a high degree of concern that the rise in interest rates will have much impact on the property market. Commenting on the figures, Robert Gardner, Nationwide's Chief Economist, said, “Providing the economy does not weaken further, the impact of a further small rise in interest rates on UK households is likely to be modest.
“This is partly because only a relatively small proportion of borrowers will be directly impacted by the change. Most lending on personal loans and credit cards is fixed or tends to be unaffected by movements in the Bank Rate. Similarly, in recent years, the vast majority of new mortgages have been extended on fixed interest rates.”
WimbledonSW19.com is the only place that you will find detailed analysis of the Wimbledon property market.
Wimbledon Property Prices (April-June 2018) |
||||||||||
|---|---|---|---|---|---|---|---|---|---|---|
| Area | Detached | Sales | Semi-det | Sales | Terrace | Sales | Flat/ mais |
Sales | Overall ave | Total sales |
| SW19 1 | 0 | 0 | 950000 | 2 | 743154 | 13 | 417563 | 15 | 594148 | 30 |
| SW19 2 | 0 | 0 | 677500 | 1 | 547500 | 6 | 398455 | 14 | 454327 | 21 |
| SW19 3 | 0 | 0 | 1022722 | 4 | 762038 | 13 | 477500 | 3 | 771494 | 20 |
| SW19 4 | 2375000 | 1 | 2061667 | 3 | 945000 | 1 | 588583 | 6 | 1185136 | 11 |
| SW19 5 | 3533333 | 3 | 0 | 0 | 1146700 | 3 | 694986 | 4 | 1682004 | 10 |
| SW19 6 | 0 | 0 | 560000 | 1 | 912500 | 2 | 450679 | 14 | 511441 | 17 |
| SW19 7 | 4445000 | 3 | 1725000 | 3 | 1220000 | 2 | 1007500 | 2 | 2296500 | 10 |
| SW19 8 | 1395000 | 1 | 885000 | 2 | 868432 | 14 | 374000 | 8 | 732602 | 25 |
| Total | 3463125 | 8 | 1272399 | 16 | 808531 | 54 | 468216 | 66 | 851572 | 144 |
Change in Quarter |
30.0% | -52.9% | 17.9% | -5.9% | -2.1% | -27.0% | 3.5% | -35.9% | 4.9% | -31.8% |
Change in year |
15.3% | -42.9% | 16.6% | -38.5% | 2.1% | -28.0% | 5.9% | -41.6% | 8.0% | -36.8% |
Change in Three Years |
36.5% | -55.6% | 4.7% | -55.6% | 13.6% | -44.9% | 17.0% | -61.2% | 20.7% | -55.3% |
| Change in Five Years | 47.3% | -33.3% | 7.8% | -68.6% | 32.3% | -53.4% | 45.5% | -62.7% | 40.2% | -59.6% |
| Change in Ten Years | 78.8% | -50.0% | 57.0% | -52.9% | 59.1% | -23.9% | 64.0% | -71.1% | 86.1% | -58.7% |
Source: Land Registry
August 9, 2018
