Wimbledon Property Market Continues To Out-Perform Capital Prices
Prices paid for SW19 homes show another year-on-year increase
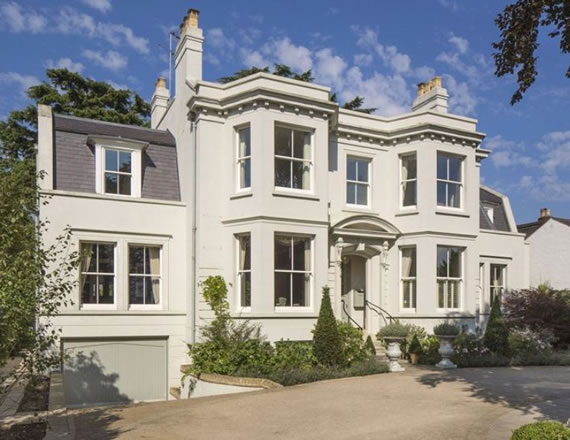
Pictured above is a property sold for £8.9m in Somerset Road, Wimbledon Village
Wimbledon property prices continue to perform better than the rest of London, with the latest sales data showing prices averaging over £875,000 in the first quarter of 2019.
This puts prices at 9.8% above the level seen in the same period last year, although prices have dipped in the last quarter.
Average prices of all properties sold fell by 4.7% between the final quarter of 2018 and January-March 2019. While the prices of flats held their own by increasing 4.7% compared with the previous quarter, prices of terraced homes fell by 14.1%.
However, the overall price level in SW19 has again been boosted with the sale of some high ticket detatched properties, including the £8.9m paid in February for a six-bedroom house in Somerset Road, Wimbledon Village.

The Nationwide’s House Price Index showed that London had the fastest pace of decline in the UK in the first quarter of 2019 with prices down by 3.8% compared with the same period in 2018 averaging £455,594. This is the steepest fall for the area since 2009 and the seventh consecutive quarter in which prices have declined. The Nationwide’s analysts say this partly reflects the level of price outperformance previously seen in the capital and the impact of policy changes on the Buy to Let market which has had a bigger effect on London because the private rental sector accounts for a larger proportion of the housing stock than elsewhere in the country.
Commenting on the figures, Robert Gardner, Nationwide's Chief Economist, said, “UK house price growth remained subdued in March, with prices just 0.7% higher than the same month last year.
“Indicators of housing market activity, such as the number of property transactions and the number of mortgages approved for house purchase, have remained broadly stable in recent months, even though survey data suggests that sentiment has softened.
“Measures of consumer confidence weakened around the turn of the year and surveyors report that new buyer enquiries have continued to decline, falling to their lowest level since 2008 in February.”
The March 2019 RICS UK Residential Survey results show little departure from the subdued picture evident across the sales market for several months now. They say forward looking indicators suggest this lack of momentum is likely to continue for a while longer, although perceptions on the twelve month outlook are a little more sanguine. However London and the South East continue to display the weakest sentiment in terms of prices.
WimbledonSW19.com is the only place that you will find detailed analysis of the Wimbledon property market. Register to receive fortnightly updates including regular reports like this one.
Wimbledon Property Prices (January - March 2019) |
||||||||||
|---|---|---|---|---|---|---|---|---|---|---|
| Area | Detached | Sales | Semi-det | Sales | Terrace | Sales | Flat/ mais |
Sales | Overall ave | Total sales |
| SW19 1 | 0 | 0 | 0 | 0 | 682009 | 11 | 472429 | 7 | 600506 | 18 |
| SW19 2 | 0 | 0 | 455000 | 1 | 452303 | 4 | 386000 | 9 | 409872 | 14 |
| SW19 3 | 1365000 | 5 | 1152792 | 12 | 904750 | 8 | 504614 | 9 | 954060 | 34 |
| SW19 4 | 3053667 | 3 | 1352500 | 3 | 815000 | 2 | 505600 | 5 | 1336654 | 13 |
| SW19 5 | 3743750 | 4 | 0 | 0 | 730000 | 1 | 554200 | 5 | 1847600 | 10 |
| SW19 6 | 2500000 | 1 | 0 | 0 | 868750 | 6 | 446872 | 20 | 616665 | 27 |
| SW19 7 | 2650000 | 2 | 1400000 | 2 | 0 | 0 | 860200 | 10 | 1193000 | 14 |
| SW19 8 | 0 | 0 | 1355000 | 5 | 856875 | 20 | 385808 | 13 | 761263 | 38 |
| Total | 2584067 | 15 | 1213957 | 23 | 793448 | 52 | 502262 | 78 | 875701 | 168 |
| Change in Quarter | -29.4% | -16.7% | -6.6% | 0.0% | -14.1% | -30.7% | 4.8% | -41.4% | -4.7% | -32.5% |
| Change in year | -3.0% | -11.8% | 12.4% | 35.3% | -3.9% | -29.7% | 10.9% | -30.4% | 9.8% | -23.6% |
| Change in Three Years | 8.6% | 15.4% | -13.1% | -32.4% | -6.0% | -57.4% | 11.1% | -59.2% | 17.7% | -53.3% |
| Change in Five Years | 41.1% | -25.0% | -0.4% | -20.7% | 16.6% | -52.3% | 28.2% | -55.2% | 35.7% | -49.4% |
| Change in Ten Years | 54.5% | 25.0% | 45.8% | 43.8% | 77.0% | 26.8% | 103.3% | 36.8% | 67.6% | 33.3% |
Source: Land Registry
May 10, 2019