Big Ticket Property Sales Take SW19 Prices To Record Levels
Prices continue to edge higher as terraced home market remains buoyant
Wimbledon property prices continue to perform better than the rest of London, with the latest sales data showing prices hit a record average high of nearly £950,000.
But this figure, which represents a 20.9% year-on-year increase, was skewed by the £40.25m sale of the Pinnacle House offices in Hartfield Road.
Another 'big ticket' sale in the Land Registry figures for July-September 2018 was the £14m paid for Grade II-listed West Lodge on West Side Common. The 12-bedroom property is pictured below.
More significant is that the average sale of a terraced house in SW19 looks to be at an all-time high at nearly £875,000. There were 21 sales of terraced homes costing more than £1m in the quarter.
But, as with the previous quarter, the volume of flat sales has fallen again - by a year-on-year decrease of 26%. The average price of a flat at £445,071, also represented an annual decrease of 5.8%. But the volume of house sales continues to help hold up the SW19 figures, with the number of terraced homes sold during the year increasing by 8.8% and prices rising by 4%.
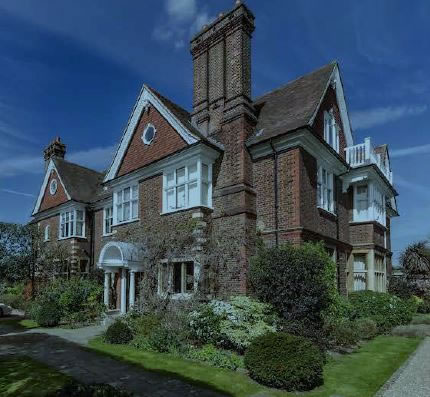
Pictured above is West Lodge on West Side Common

The latest figures from the Nationwide's House Price Index show that prices nationally have continued to rise slowly with the average sale price now £214,534 up by 1.6% over the year.
Commenting on the figures, Robert Gardner, Nationwide's Chief Economist, said, “Looking further ahead, much will depend on how broader economic conditions evolve. If the uncertainty lifts in the months ahead, there is scope for activity to pick-up throughout next year. The squeeze on household incomes is already moderating and policymakers have signalled that interest rates are only expected to raise at a modest pace and to a limited extent in the years ahead.”
The October 2018 RICS UK Residential Market Survey results show the recent softening in new buyer demand beginning to feed into a slightly negative trend for national house prices in the view of the surveyors’ industry body.
The report says, “A sustained softening in demand over recent months has likely driven the weaker price trends in parts of the country. The net balance for new buyer enquiries ticked down to -14% in October (compared with -12% last month), marking three successive reports in which headline demand has deteriorated. Affordability pressures, political uncertainty and a lack of fresh stock coming onto the market all continue to hinder activity to varying degrees.”
The report adds that new instructions to surveyors continue to fall meaning stock levels remain close to all-time lows and rendering any chance of a meaningful turnaround in the near future unlikely. A net balance of 30% of respondents reported the level of appraisals being undertaken to be down on an annual comparison.
Looking ahead, respondents in London and the South East were the most negative with price falls expected over the next twelve months.
WimbledonSW19.com is the only place that you will find detailed analysis of the Wimbledon property market. Register to receive fortnightly updates including regular reports like this one.
Wimbledon Property Prices (July - September 2018) |
||||||||||
|---|---|---|---|---|---|---|---|---|---|---|
| Area | Detached | Sales | Semi-det | Sales | Terrace | Sales | Flat/ mais |
Sales | Overall ave | Total sales |
| SW19 1 | 0 | 0 | 1340000 | 4 | 697829 | 12 | 435800 | 10 | 695844 | 26 |
| SW19 2 | 0 | 0 | 752500 | 3 | 565819 | 8 | 403059 | 17 | 487002 | 28 |
| SW19 3 | 830000 | 1 | 1108182 | 11 | 852694 | 18 | 518600 | 5 | 884614 | 35 |
| SW19 4 | 6191333 | 3 | 2565000 | 3 | 1137500 | 2 | 559357 | 7 | 2163967 | 15 |
| SW19 5 | 2844000 | 5 | 1060000 | 1 | 1405000 | 3 | 570833 | 6 | 1528000 | 15 |
| SW19 6 | 0 | 0 | 643250 | 2 | 584120 | 1 | 378383 | 12 | 427415 | 15 |
| SW19 7 | 3503333 | 3 | 1363100 | 5 | 1283750 | 4 | 551400 | 5 | 1483382 | 17 |
| SW19 8 | 0 | 0 | 1040625 | 8 | 940559 | 23 | 379943 | 13 | 793116 | 44 |
| Total | 3677833 | 12 | 1215932 | 37 | 874521 | 71 | 445071 | 75 | 946640 | 195 |
Change in Quarter |
7.5% | 20.0% | -5.5% | 76.2% | 11.5% | -5.3% | -0.7% | -38.0% | 23.3% | -14.1% |
Change in year |
38.3% | -14.3% | -5.1% | 8.8% | 4.0% | -26.0% | -5.8% | -52.2% | 20.9% | -35.2% |
Change in Three Years |
43.9% | -36.8% | -16.9% | -5.1% | 6.3% | -44.1% | 5.3% | -54.0% | 18.1% | -44.0% |
| Change in Five Years | 63.4% | -40.0% | 6.9% | -38.3% | 34.3% | -41.8% | 28.5% | -69.6% | 52.8% | -56.6% |
| Change in Ten Years | 96.9% | 20.0% | 84.6% | 0.0% | 77.6% | 0.0% | 63.1% | -53.1% | 116.3% | -29.9% |
Source: Land Registry
November 22, 2018