Average Price of Wimbledon Home Reaches New High
Market shift from flats to houses boosts level to record
Property prices in Wimbledon have reached another record high as the average price of an SW19 home sold so far this year reached more than £850,000. This represents a 15.4% rise over the same period in 2016.
The main driver of the rise in the average seems to be a shift in the type of property being sold with more larger sized homes changing hands. The price rises for specific property types are much more muted.
Stuart Mills, Sales Manager at Jackson-Stops Staff in Wimbledon Village said. "Over the last 12 months we have seen some changes in the market, last April saw changes to the stamp duty rules, and then of course we had the Brexit vote. Looking at these figures we see a drop in sales of flats. This I think is a direct result of investors not buying, due to firstly increased stamp duty costs, an additional 3% over and above, the normal cost, plus the encroaching changes in taxation on income derived from investment properties. These 2 factors are giving food for thought to many who have owned investment properties, and may now consider selling. This part of the market could become saturated with sellers over the next 18 months, in turn making the selling time slower, and no doubt putting pressure on prices."
The figures for the January-March 2017 quarter (see full table below) have been boosted by a market shift in the area from flats to costlier houses. Typically about 50-60% of Wimbledon property sales are of flats, but so far this year the proportion of flats sold has been well under half.
Stuart says of this trend, "The strongest part of the market is terraced houses, almost certainly driven by being in school catchment areas. This is one of the biggest markets across London, with good schools seeing catchment areas becoming ever smaller, driving prices up, on the houses closest to the schools, due to competition from eager parents."
Simon Rubinsohn, RICS Chief Economist sees the lettings market as being stronger than the sales side. He said, "It is noticeable that the amount of new rental instructions coming through to agents is continuing to edge lower, which is not altogether surprising given the changing landscape for buy-to-let investors. One consequence of this is that rents are expected to continue rising not just in the near term but also further out and at a faster pace than house prices."
Stuart Mills comments, "The lettings market analysis is interesting, there is some anecdotal evidence that rents are actually coming down, and Jackson Stops Wimbledon lettings department have seen this over the first 4 months of the year. From late last year, the amount of available property grew, and with greater choice, rents become more negotiable. This is beginning to change, perhaps as suggested, some buy to let landlords look to sell property. One point that is very evident in this market, is that tenants are now looking for higher quality housing. No longer can landlords get away with offering only average properties if they wish to secure a good to premium rent. This seems to be the case across all types of property."
He remains concerned about the level of transactions and points out that affordability is making it difficult for many to get on the housing ladder with the bank of mum and dad now the 9th largest lender in the country, with over £6 billion invested. He is looking for the next government to take action to tackle the issue of affordablility.
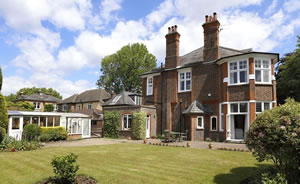
Among the most expensive houses sold recently were a £6.15 million property in Atherton Drive, Wimbledon Village. A 5-bedroom home (pictured above), including 2-bed annexe, in The Grange, near Wimbledon Common, reached £6m in January.

During March 2017 London was the worst performing region of the country according to the Land Registry with prices falling by 1.5% from the previous month to £471,742. Over the course of the last twelve months prices have risen by 1.5%.
For England as a whole prices are up by 4.4% in the year to March rising to an average of £232,530.
The number of completed house sales in London in January, the latest month for which figures are available, fell by 26.3% to 5,968 compared with 8,093 in January 2016.
The numbers below are subject to revision as is it usual that some properties are added late to the Land Registry's database.
WimbledonSW19.com is the only place that you will find detailed analysis of the Wimbledon property market.
Wimbledon Property Prices (January - March 2017) |
||||||||||
|---|---|---|---|---|---|---|---|---|---|---|
| Area | Detached | Sales | Semi-det | Sales | Terrace | Sales | Flat/ mais |
Sales | Overall ave | Total sales |
| SW19 1 | 0 | 0 | 718333 | 3 | 701150 | 10 | 416393 | 14 | 555407 | 27 |
| SW19 2 | 0 | 0 | 720000 | 1 | 475200 | 5 | 390246 | 12 | 432164 | 18 |
| SW19 3 | 1525000 | 1 | 1009955 | 11 | 754857 | 7 | 422222 | 9 | 775661 | 28 |
| SW19 4 | 3721500 | 3 | 1630000 | 3 | 1559250 | 2 | 570636 | 7 | 1544497 | 15 |
| SW19 5 | 3750000 | 3 | 1075000 | 1 | 1328333 | 3 | 723750 | 4 | 1745909 | 11 |
| SW19 6 | 0 | 0 | 0 | 0 | 688667 | 3 | 346529 | 12 | 414957 | 15 |
| SW19 7 | 2072500 | 1 | 2000000 | 2 | 1240000 | 2 | 623250 | 4 | 1227278 | 9 |
| SW19 8 | 0 | 0 | 1443750 | 4 | 888088 | 17 | 491612 | 4 | 913558 | 25 |
| Total | 3251500 | 8 | 1188980 | 25 | 845276 | 49 | 451814 | 66 | 857937 | 148 |
| Change in Quarter | 2.2% | -38.5% | -3.6% | 8.7% | 1.6% | -37.2% | 2.0% | -47.6% | 8.1% | -38.3% |
| Change in year | 36.7% | -38.5% | -14.9% | -26.5% | 0.1% | -59.8% | 0.0% | -65.4% | 15.4% | -58.9% |
| Change in Three Years | 77.6% | -60.0% | -2.4% | -13.8% | 24.2% | -55.0% | 15.3% | -62.1% | 32.9% | -55.4% |
| Change in Five Years | 61.2% | 14.3% | 37.1% | 0.0% | 63.1% | -40.2% | 51.4% | -55.7% | 83.8% | -43.7% |
| Change in Ten Years | 61.2% | -73.3% | 63.4% | -37.5% | 85.3% | -61.1% | 66.0% | -73.5% | 77.7% | -66.7% |
Source: Land Registry
May 26, 2017
Related links
|