Wimbledon Village Is Covid-19 Infection Hotspot
Number of cases across Merton is also higher than the national average
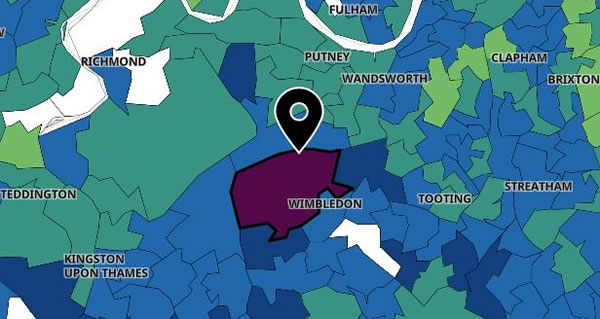
Map based on ONS figures show rates of infection. Darker colour equals higher rate
The latest official data is showing that the number of Covid-19 infections in the Wimbledon Common and Village area have spiked during the last week.
Data from the Office of National Statistics (ONS) also shows that the rate of infection across the borough of Merton is above the English average for the week up to 28 November.
In a specific area the ONS labels Wimbledon Common, but which includes Wimbledon Village, there were 25 cases during the week, a rise of 20 from the previous week and a rolling infection rate of 448.8 people per 100,000. It is shown as purple on the above map.
Neighbouring Wimbledon Park & Durnsford Road had 19 cases in the week, an increase of 12 of the previous rate and a rolling rate of 225.8 per 100,000. Cottenham Park had 28 cases, which represented a rolling rate of 349.3
The Merton figure per 100,000 was 164 for the same week. The average for the neighbouring borough of Wandsworth was 103, while Sutton was 125 and Kingston 179. The England average was 155, which is the same as London as a whole.
The area the ONS labels Wimbledon Hill, but which encompasses the town centre had 15 cases in the week, an increase of six from the previous week and a rolling rate of 189.4 per 100,000.
But south of Wimbledon Broadway, there had been fewer than three cases in the week. Here the number of cases has fallen to levels where the ONS does not publish figures to protect the privacy of individuals. It is possible therefore that in this area - shown as white on the map - there were no cases at all.
London's Tier 2 status will be reviewed on December 16, but there are higher rates of infection in some east London boroughs such as Barking & Dagenham, Havering and Redbridge, with the latter having nearly twice the rate of infection of Merton.
December 4, 2020